Searching, Reporting, and Charts
Searching
Search for specific records
Martus searches all records every label, unless the record only exists in the Trash.
Perform a Simple Search
The simple search allows you to search your records from the Martus main taskbar.
- Input your search terms in the Search field of the Martus main taskbar.
- Select the Search icon
 or simply hit Enter on your keyboard. Your search results will be listed in the record list pane under the heading Search Results.
Saving Your Search Results
- Once you perform your search, select any results that you would like to save.
- Select the Move icon
 in the taskbar beneath the list pane.
 - Choose an existing folder.
- Select Move.
Note: You may also create a new folder for your search results using the Add icon  in the Martus sidebar and then follow the above directions to perform a search.
Perform an Advanced Search
- Select Analysis > Advanced Search
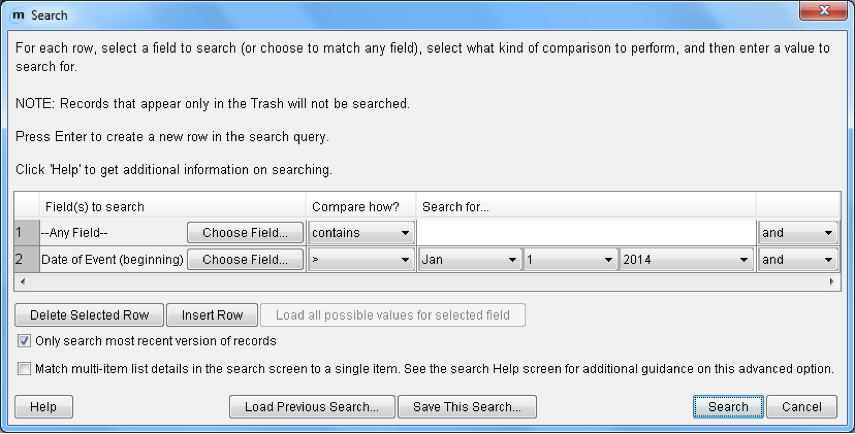
- In the Search dialog box, select the field to search, indicate how the record field should compare to the search terms, and enter the word(s) or date(s) you are searching for. You can search for words in any language. If you are searching for terms in a multi-item list, select which detail in the item to search. When selecting text fields, you can ask Martus to scan and load all the values that have been entered for those fields in your records on the local computer by selecting the Load all possible values for selected field checkbox in the field selection screen. For other field types the checkbox will be “grayed out” (i.e. not selectable).
- If you would like to add additional search constraints, press Enter or click Insert Row to create a new search row. You can search another field or limit your search to a certain date or date range.
- If you would like to delete a search constraint, select that row and click Delete Selected Row.
- Click Search. A dialog box will display the search progress, and allow you to cancel the search at any time if you wish.
- When the search is complete, the Search Results dialog box reports how many records were found that matched your criteria. Click OK.
- The Search Results folder lists the records found in your search. (The folder contains copies of the records; the originals remain in their original folders.) If your search resulted in no records, the Search Results folder will still contain the records from the previous search.
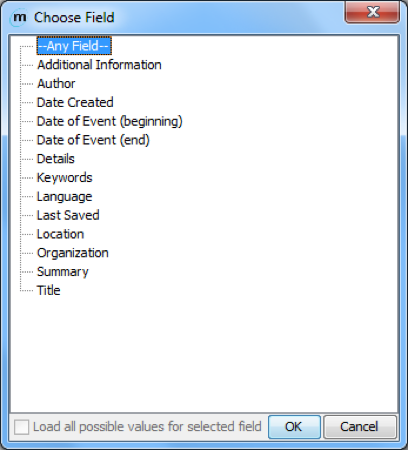
There is also a Load all possible values for selected field button in the main Search screen, if users want to load field values without going into the field selection screen (for example, after loading a previously saved search, or if they did not select the checkbox in the field selection screen). For “data-driven dropdown” (dropdown lists created by data entered in record grids), the values that were entered in records are automatically loaded when the field is chosen in the Search screen. See Customize record fields for more about data-driven dropdown fields.
Note: If multiple fields have the same label in the field selection screen, click the plus sign next to the label name to choose the appropriate field. Martus displays the tag name and field type (e.g., “text”) for each field with that label. If you have multiple dropdown fields with the same label, Martus will merge all the values into one list in the Search screen. Any customized field labels that contain only spaces will be replaced with that field's tag in the search field list.
Note: There are several ways record fields can compare to search terms.
contains: Any records in which the specified field contains the search terms
=: Only the records in which the specified field exactly matches the search terms
!= : Records in which the specified field does not match the search terms
>: Records in which the field’s value is greater than the search value
>= : Records in which the field’s value is greater than or equal to the search value
< : Records in which the field’s value is less than the search value
<= : Records in which the field’s value is less than or equal to the search value
Notes on Searching for Records
- Martus searches all versions of every record. Search criteria may match an earlier version of the record. To access previous versions click the Record Details> button at the bottom of the record. For more information, see View earlier versions of a record.
- To search only the most recent versions of records, select Only Search Most Recent Versions of Record in the Search dialog box. The Search dialog box will remember this selection the next time you run a search.
- Martus searches all rows of any grid (table) fields for criteria and doesn’t require that the terms are all on the same row. See Creating Customized Templates for more information about grid fields.
- To specify that all grid column specifications in the Search screen be matched to a single row of record grid data, check the Match grid column specifications… checkbox in the Search screen. For example, to search for a specific victim name in a single grid row created after a certain date, select the checkbox and enter the following fields in the Search screen: "Victim Information: First Name" = x and "Victim Information: Last Name" = y and "Date Created" >= YYYY-Mon-DD. Without selecting the Match grid column specifications… checkbox, Martus will find records created after the specified date where any row has the first name specified and any other row has the last name specified.
- Because Martus searches all rows of any grid (table) fields for criteria, it may find records where one grid row matches your criteria but other rows do not. For example assume a record with multiple rows of data corresponding with locations A, B, and C. When searching for records where location != C (does not equal C), Martus will find that record as there are 2 rows in the record grid where the location is not C.
- Searches on a multi-level dropdown are exact matches, not partial or “starts with” matches, searches must pick the exact level that should be searched. For example, an “Event Location” field that has three levels (State/City/Neighborhood) will have three entries in the search field list: Event Location: State, Event Location: City, and Event Location: Neighborhood. To search all records that have an Event Location anywhere in California (regardless of the City), select the “Event Location: State” field to search on and pick California off the dropdown list choices. If selecting Event Location: City to search on and then pick California but leave the City level blank, Martus will only find entries where there was no City data entered (City was blank), as opposed to ANY location with California regardless of what data was entered at the City level.
- Martus may use the tag and field type to try and determine when different fields were meant to be the same when it searches. We encourage you to make field tags and labels in a customization clearly related to each other to avoid any confusion. See Creating Customized Templates for more information about configuring custom fields.
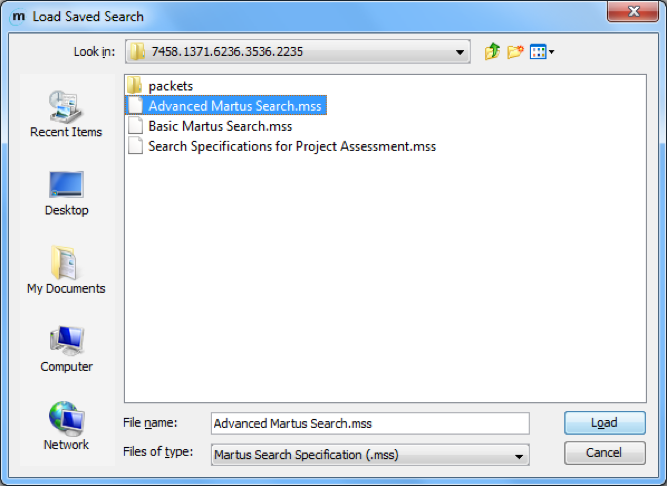
To save your search criteria, click Save This Search in the Search dialog box. Then, give the search criteria a name you’ll recognize later. Martus saves it with the .mss (Martus Search Specification) extension in the folder you choose. To use search criteria you’ve saved, click Load Previous Search in the Search dialog box, and then navigate to the .mss file you want to use.
Note: Martus will remember the immediately previous search criteria without you needing to load it.
Search Tips
- To search for an exact phrase, type it with quotation marks around the phrase (e.g., "Witness Testimony"). If you do not put quotation marks around the phrase, Martus will search for the words individually.
- Martus will find the text you enter whether it’s a complete word or part of a larger word. For example, if you search for the word prison, you’ll see records that include the words prison, imprison, and imprisonment. Likewise, if you search for the word prison, Martus will find records that include attachments with names such as photos-prison.jpg and prisoners-report.doc.
- You can search for words in any language. Martus searches are not case-sensitive in English and other purely Latin character languages, so it doesn’t matter whether a word is capitalized or not.
- Use the word “or” to broaden your search, or the word “and” to narrow it. You can use the and / or dropdowns to specify different fields you want search across (e.g., you want to search for records that have "Last Saved Date" in the last week and have a certain author). If you want to search on multiple text values within a single record field, you can use “or” or “and” in-between words in the Search For... entry box. For example, if you search "Any Field" for prison or jail you’ll see a list of records that contain either word anywhere in the record. If you search for prison and assault you’ll see a list of records that contain both words. The keyword "and" is implied, so if you search for prison assault Martus will find the same records as if you searched for prison and assault.
- When you use both "and" and "or", your search terms are grouped from the beginning of your list (either across record fields or within a particular field). For example, if you enter prison or jail and trial in the Search For... entry box, Martus will search for any records that contain either of the words prison or jail, and also contain the word trial. But if you enter prison and jail or trial Martus will search for any records that contain both the words prison and jail, or contain the word trial.
- If you are using a language other than English, you can use the translation of the words "or" or "and" in that language or you can use the English words "or" and "and" to search. For example, if you are using Martus in Spanish, use the word "o," "y," "or," or "and" when searching.
- For languages that do not use spaces to separate words, you need to put spaces before and after any “or” / “and” keywords you use in your search.
Martus is finding either more or fewer records than I expected. What could be causing this?
I deleted a record from the Trash, but it still appears in another folder (or search).
Create Reports
You can create customized reports from information in the records on your computer, and then print those reports to a printer or to an HTML file (which can be opened in a browser, or other application such as word processor or spreadsheet for further editing/formatting if desired.)
To create a report:
- Choose Analysis> Reports.
- To create a new report format, click Create New Tabular Report or Create New Page Report. A tabular report lists record fields as columns in a table, with each record as one row in the table. A page report lists the selected subset of fields from each record separately, and is formatted as records appear when printed individually.
- In the Create Report dialog box, select the fields you want to include in the report, and then click OK.
- In the Save Report Format As dialog box, enter a name for the format you’ve created, and then click Save. Martus saves the report format with an .mrf extension in the directory you choose (it will put it in your Martus account directory by default).
- In the Search dialog box, enter the criteria for records you want to include in your report. To use search criteria you’ve previously saved, click Load Previous Search. When you’ve entered the search criteria, click Search. For more information on searching, see Searching for specific records.
- Specify the records’ order in the report. You can select up to three fields by which to sort. Martus sorts the records by the first field you choose, and if multiple records have the same information in the first field, it then sorts by the second field, and finally by the third field. For each field, click Choose Field…, select the field you want Martus to sort by, and click OK.
- Choose whether to print only the record information, only summary counts, or both. If you include summary counts, the report contains total counts of records grouped by the fields you’ve chosen to sort the records on. For example, if you’re sorting by author and you choose to print the record information and summary counts, the report will include the record data and a summary of how many records were created by each author.
- Martus displays a preview of the report that will print. Click Print to Printer to print the report to your printer. Click Print to File to save the report as an HTML file that you can open in a web browser or word-processing/spreadsheet application. If you want to make changes to the report before printing, click Cancel, choose Analysis> Reports, and create a new report format.
If you want to use a report format you’ve previously saved, click Use Existing Report Format, open the saved .mrf (Martus Report Format) file and skip to step 5.
If you’re creating a tabular report, click Add in the Organize Report Fields dialog box to open the Create Report dialog box, select the fields you wish to include and hit OK. You can then change the order of fields on the report by selecting a field and clicking Move Up or Move Down. Click OK when you’ve arranged the fields the way you want them.
Note: If you cancel out of the Save Report Format As dialog box, your report format will be lost. You must save each report format you create in order to run the report.
Note: Martus will remember the immediately previous search criteria without you needing to load it.
Note: Martus will remember the immediately previous sort selection until you exit Martus.

Note: You can copy and paste text from the preview screen directly into other applications, e.g., word-processors or spreadsheets.
Note: Martus only displays data from the latest version of each record on your computer in the report.
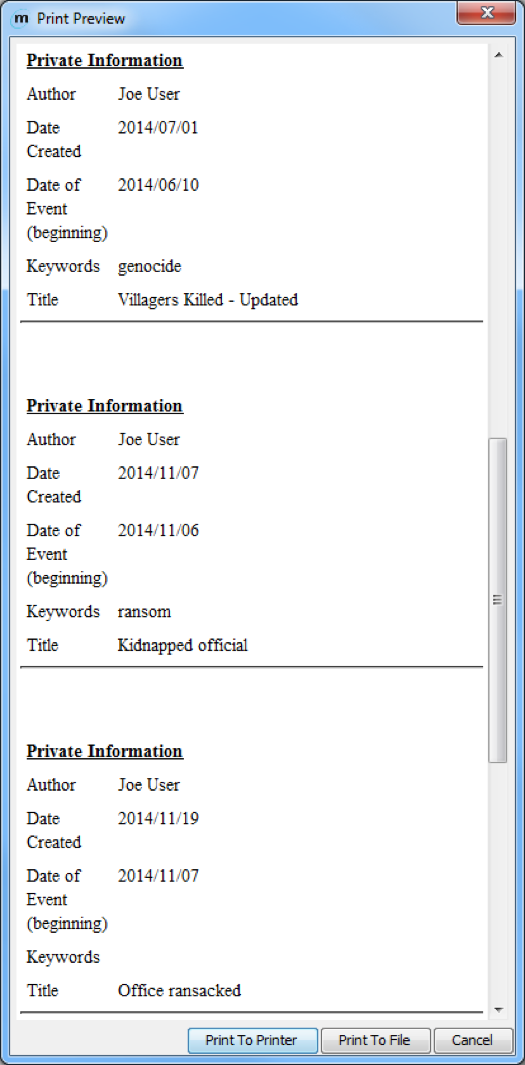
See examples of reports below:
Tabular report with summary counts:

Page report without summary counts:
Important Notes on Reports
- Martus reports are intended to give you information about the status/progress of data that has been gathered and entered in Martus, but not to analyze “what happened” from the data that has been entered. So for example we can count the number of records that came from a particular time frame or region (if your project is collection that information), but not how many killings there were in a particular region.
- Martus reports are also meant to focus on fields in which the information is distinct for a record or source document. For example, you can design reports to search for all records entered by a certain user, or given by individuals of a given ethnicity (if your project is collecting that information).
- Martus reports do not correct for the following:
- Sampling bias (e.g. all records entered being more from one particular region than any others, even if the project is covering incidents that happened across all of them).
- Duplicate reporting (i.e. more than one record may exist about the same incident, or the same person may be mentioned using different names, or there may be multiple people with the same name).
- Data quality issues (e.g. typos that might lead to a search not finding records, fields being left blank where values were expected). Some of these issues can be addressed in a project customization, by requiring certain fields to be entered before a record or grid row can be saved, or using dropdown fields to avoid typos and guarantee consistency in searching.
- Possible inconsistency in how data is entered in Martus by different people. For more on this topic, see "Controlled Vocabulary" and the “Inter-rater Reliability” section on https://hrdag.martus.org/resources/core_concepts.shtml
- Martus reports especially should not attempt to count the number of violations, victims or perpetrators, beyond counting the number of records that match search criteria. Before counting violations or victims/perpetrators, important data processing needs to take place before such counting can be considered scientifically defensible. This includes addressing the possibility of duplicate reporting (more than one record may exist about the same incident); representing the complexity of human rights violations (an individual who was the victim of a given act may later become the perpetrator of a different act, or vice versa); and maintaining consistency in meaning and counting (ensuring, for example, making sure that all the data entered in records used consistent definitions for violations.)
- If you would like to perform descriptive or qualitative analysis of the information entered into Martus, Benetech can help you to use a tool to export and summarize data for your project. The exported data may be able to be reviewed using analytical tools, but please keep in mind that quantitative or inferential statistical analysis cannot be performed until additional steps have been taken in processing the data, and without enough volume and different sources of data, statistical analysis may not give meaningful or reliable results.
Martus is finding either more or fewer records than I expected. What could be causing this?
Create Charts
You can create customized charts from information in the records on your computer, and then print those reports to a printer or to a JPEG image file (which can be opened in various applications such as image display tools, or a word processor for further editing/formatting if desired.)
To create a chart:
- Choose Analysis > Charts.
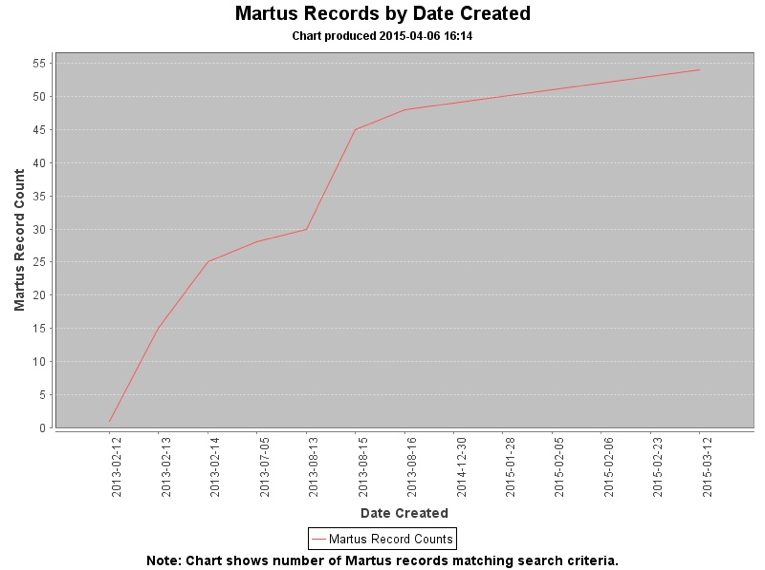
- Select click Bar Chart, 3D Bar Chart, Pie Chart, or Line Chart from the Type of Chart dropdown list. A Bar or 3D Bar Chart shows counts of records for each value of the field you select, while a Pie Chart shows both the counts of records and the percentage of total records that match your defined search criteria (chosen when you create the chart). A Line Chart shows the number of records created over the life of an account. See examples below for each type of chart.
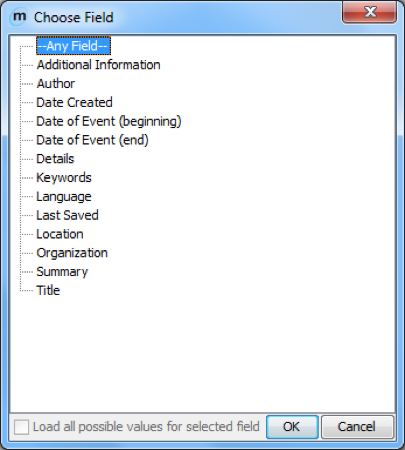
- Click on the Choose Field… button to select the field you want to include in the chart, pick a field from the list (which will include all the standard or custom fields that are in any of the records on your computer), and then click OK.
- If desired, enter text that will be displayed beneath the title of the report in the Subtitle field (e.g. “Human Rights Organization data collection monthly status report”).
- Hit the OK button.
- In the Search dialog box, enter the criteria for records you want to include in your chart. To use search criteria you’ve previously saved, click Load Previous Search. When you’ve entered the search criteria, click Search. For more information on searching, see Searching for specific records.
- Martus displays a preview of the chart. Click Print to Printer to print the report to your printer (Martus will automatically scale the printout to fit the page width, based on your printer preferences). Click Print to File to save the report on your computer as a JPEG image file that you can open in the image display program of your choice, or copy/insert into a word-processing application. If you want to make changes to the report before printing, click Cancel, choose Analysis > Charts, and create a new chart.
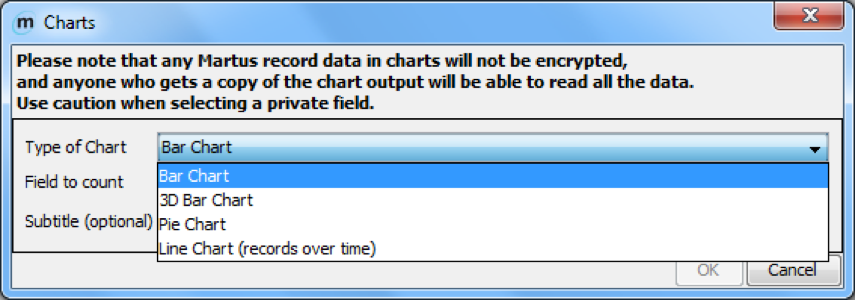
Note: Any data displayed in charts will not be encrypted. Anyone accessing the chart (in printed or electronic form) will be able to access all the included data.
Note: Martus will remember the immediately previous search criteria without you needing to load it.
Note: Martus only displays data from the latest version of each record on your computer in the chart.
Examples of charts:
Bar Chart:

3D Bar Chart:

Pie Chart:

Line Chart (Records over Time):
Important Notes on Charts
- Martus charts are intended to give you information about the status/progress of data that has been gathered and entered in Martus, but not to analyze “what happened” from the data that has been entered. So for example we can count the number of records that came from a particular time frame or region (if your project is collection that information), but not how many killings there were in a particular region.
- Martus charts are also meant to focus on fields in which the information is distinct for a record or source document. For example, you can design reports to search for all records entered by a certain user, or given by individuals of a given ethnicity (if your project is collecting that information).
- Martus charts do not correct for the following:
- Sampling bias (e.g. all records entered being more from one particular region than any others, even if the project is covering incidents that happened across all of them).
- Duplicate reporting (i.e. more than one record may exist about the same incident, or the same person may be mentioned using different names, or there may be multiple people with the same name).
- Data quality issues (e.g. typos that might lead to a search not finding records, fields being left blank where values were expected). Some of these issues can be addressed in a project customization, by requiring certain fields to be entered before a record or grid row can be saved, or using dropdown fields to avoid typos and guarantee consistency in searching.
- Possible inconsistency in how data is entered in Martus by different people. For more on this topic, see “Controlled Vocabulary” and the “Inter-rater Reliability” section on https://hrdag.martus.org/resources/core_concepts.shtml.
- Martus charts especially should not attempt to count the number of violations, victims or perpetrators, beyond counting the number of records that match search criteria. Before counting violations or victims/perpetrators, important data processing needs to take place before such counting can be considered scientifically defensible. This includes addressing the possibility of duplicate reporting (more than one record may exist about the same incident); representing the complexity of human rights violations (an individual who was the victim of a given act may later become the perpetrator of a different act, or vice versa); and maintaining consistency in meaning and counting (ensuring, for example, making sure that all the data entered in records used consistent definitions for violations.)
- If you would like to perform descriptive or qualitative analysis of the information entered into Martus, Benetech can help you to use a tool to export and summarize data for your project. The exported data may be able to be reviewed using analytical tools, but please keep in mind that quantitative or inferential statistical analysis cannot be performed until additional steps have been taken in processing the data, and without enough volume and different sources of data, statistical analysis may not give meaningful or reliable results.
Martus is finding either more or fewer records than I expected. What could be causing this?
Data Quality and Analysis
Martus has limited data analysis tools built into the encrypted environment that allow the user to conduct advanced searches, and create reports and charts. You can also export data as xml or csv to manipulate the data in another program but this data is now unencrypted and insecure. When analyzing your data it is important to recognize the limiting factors affecting the validity of any conclusions made from the data you have collected in Martus. Human rights groups depend on their credibility, so how they talk about their information and their conclusions is extremely important. Numbers may be sexy, but they are also easily misrepresented. Data does not equal reality. A database is a representation of what we can observe, not representative of reality, and it is important to acknowledge and represent it as such.
Selection Bias: Most human rights data is a convenience sample. Human rights violations don’t tend to be well planned or predicted—if they were we might be better at combatting them. But a convenience sample has no control. Thus any conclusions should be accompanied by warnings and explanations of the limits of your data.
Your observed data may be over or under counting violations. Undercounting based on age, geography, time, or network/population are common. Some examples:
- Age: because of legal restrictions, you are not able to interview anyone under 18; but it could be that youth are the primary victims of what you’re counting, for example, new incidents of HIV. Your sample will be skewed older and you’ll miss the main population. If you’re making policy decisions based on these conclusions, you’re going to miss the mark.
- Geography: the area of worst violence in Syria has been X, but reporters can’t get in, and few people are getting out, so abuses in that area are among the worst and most numerous, but reports are the lowest. It appears to have the least violence but actually has the most.
- Network: People tend to reach their networks first and may undercount others outside of their networks. For example, the majority of violence may be happening against a minority religious group, but an organization serving a different religious community may not be able to reach this population or seek it out and so undercounts incidents against that minority community. The same could apply for gay rights organization that traditionally has served mostly men—they may be likely to undercount lesbians because they don’t have many women in their existing network.
- Other barriers may be social taboos, language, or others. Undercounting is particularly of concern in human rights data. Human rights movements are often about fighting the oppression perpetrated by one group against another—the person who controls the information often controls the message and therefore the outcome. It’s important to make sure that those who are already disadvantaged are not further disadvantaged by being undercounted and underreached.
Overcounting occurs when there are multiple counts of the same event or incident. For example, if a woman in the DRC experiences rape, she’s likely to seek services and support from multiple centers. If they are all documenting sexual assaults against women, that incident is likely to be counted multiple times. This is common with crowdsourcing apps.
For more information on data quality considerations see: https://hrdag.org/coreconcepts